Overview
WSPR data is provided for download at https://www.wsprnet.org/drupal/downloads. Files are organized as zip archives, one month at a time. Files are provided in csv format. Fields include a timestamp, transmitter and reporter callsigns and gridsquares, frequency, distance and azimuth. Unzipped, files can be very large. I unzip then apply a python script to separate into ham bands. I’ve chosen 15 meters for analysis, and the month is December 2021. I then selected only transmitting stations in Southern California to further simplify analysis. I used the “R” language, as it is most preferred by pirates.
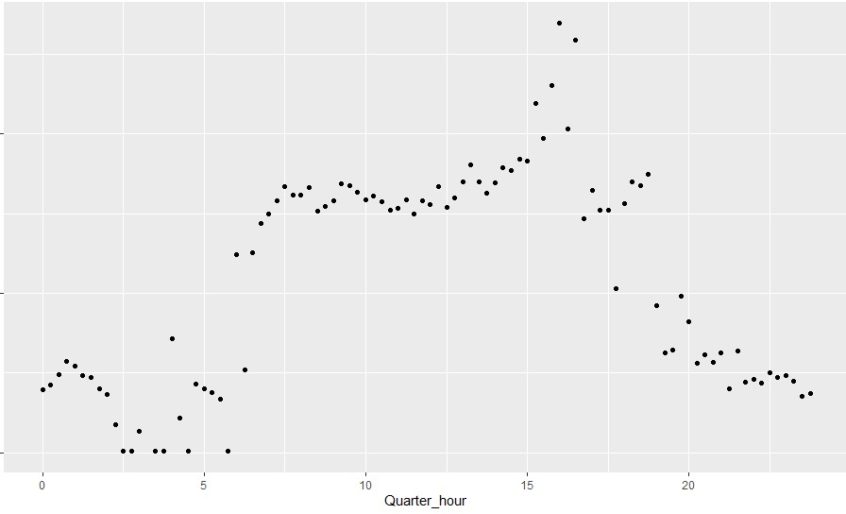
Distance by Time of Day
Time of day is averaged into 15 minute chunks. Time appears to have been converted into my local time, PST even though WSPR documentation states that times are UTC. Maybe one of the R day/time functions implicitly coverts to local time?
Average distance on 15 meters sinks during the night, rises in the morning and peaks in late afternoon. Data represents the entire month of December.
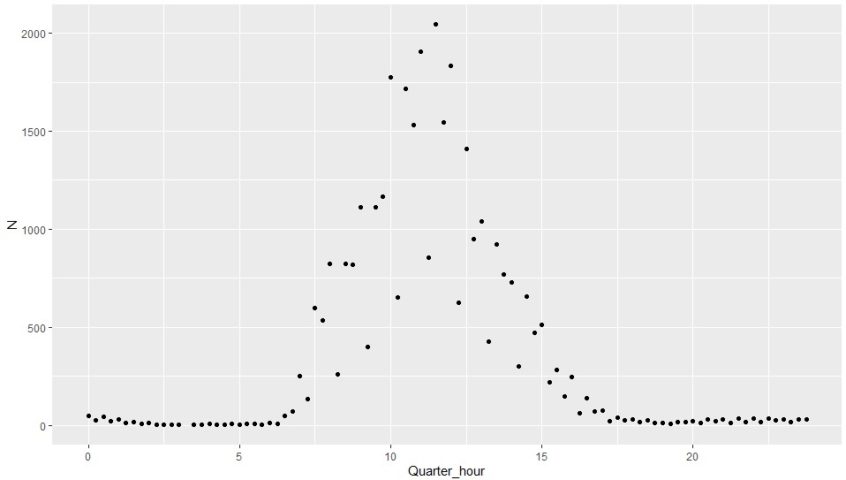
Observation Count by Time of Day
How many reception reports make up each measurement in the prior graph? I took the count for each 15 minute interval and plotted by time of day, summarizing again for the entire month. Very low during night when propagation at 21 mHz is poor, peaks around noon.
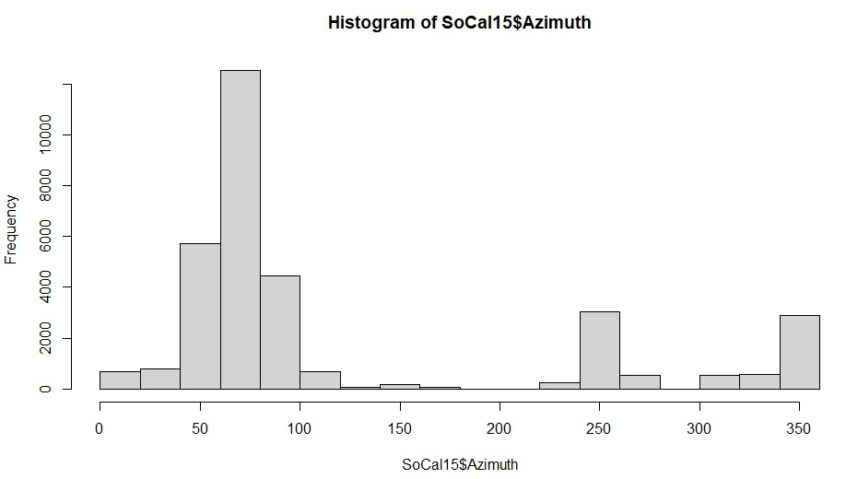
Azimuth Distribution
Where do the signals come from in terms of direction? Mainly the northeast direction (US Midwest, Canada, with a smaller peak southwest (Australia) and at due north (Seattle, Vancouver). Which is what I would expect from Los Angeles.
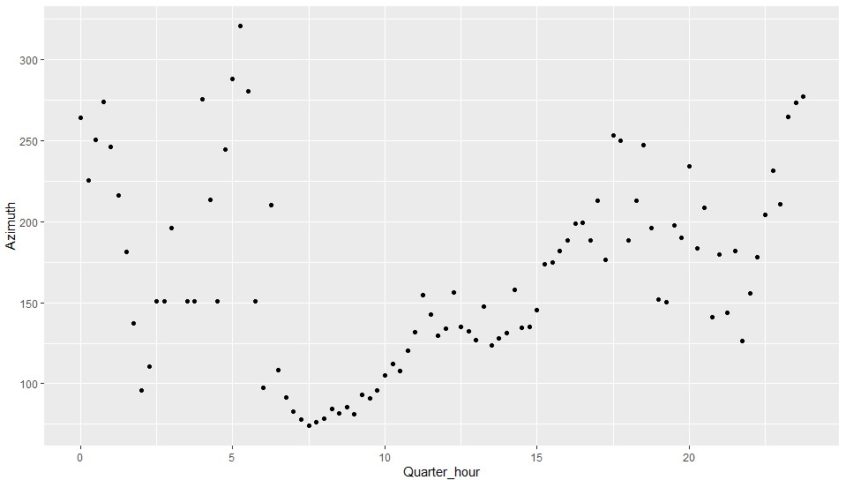
Azimuth by Time
I’m still trying to figure this out.